Visualize your GitHub identity and access management
This guide demonstrates how to set up a monitoring solution to get insights into your GitHub Identity and Access Management (IAM) using Port's GitHub integration. Understanding your organization's IAM structure helps you audit permissions, improve security, and manage access efficiently.
Common use cases
- Understand your organization's IAM structure
- Audit GitHub organization members and their roles
Prerequisites
This guide assumes the following:
- You have a Port account and have completed the onboarding process.
- Port's GitHub app is installed in your account.
Set up data model
When installing Port's GitHub app, the Repository blueprint is created by default.
However, the GitHub User and GitHub Team blueprints are not created automatically, so we will need to create them manually.
Create the Github user blueprint
Skip to the update data source mapping section if you already have the blueprint.
-
Go to the Builder page of your portal.
-
Click on
+ Blueprint. -
Click on the
{...}button in the top right corner, and chooseEdit JSON. -
Add this JSON schema:
GitHub user blueprint (Click to expand)
{
    "identifier": "githubUser",
    "title": "Github User",
    "icon": "Microservice",
    "schema": {
        "properties": {
        "email": {
            "title": "Email",
            "type": "string"
        }
        },
        "required": []
    },
    "mirrorProperties": {},
    "calculationProperties": {},
    "aggregationProperties": {},
    "relations": {}
} -
Click
Saveto create the blueprint.
Create the Github team blueprint
Skip to the update data source mapping section if you already have the blueprint.
-
Go to the Builder page of your portal.
-
Click on
+ Blueprint. -
Click on the
{...}button in the top right corner, and chooseEdit JSON. -
Add this JSON schema:
GitHub team blueprint (Click to expand)
{
    "identifier": "githubTeam",
    "title": "GitHub Team",
    "icon": "Github",
    "schema": {
        "properties": {
        "slug": {
            "title": "Slug",
            "type": "string"
        },
        "description": {
            "title": "Description",
            "type": "string"
        },
        "link": {
            "title": "Link",
            "icon": "Link",
            "type": "string",
            "format": "url"
        },
        "permission": {
            "title": "Permission",
            "type": "string"
        },
        "notification_setting": {
            "title": "Notification Setting",
            "type": "string"
        }
        },
        "required": []
    },
    "mirrorProperties": {},
    "calculationProperties": {},
    "relations": {}
} -
Click
Saveto create the blueprint.
Update data source mapping
-
Go to the Data Sources page of your portal.
-
Select the GitHub integration.
-
Add the following YAML block into the editor to ingest data from GitHub:
GitHub integration configuration (Click to expand)
resources:
- kind: repository
    selector:
    query: 'true'
    port:
    entity:
        mappings:
        identifier: .name
        title: .name
        blueprint: '"githubRepository"'
        properties:
            readme: file://README.md
            url: .html_url
            defaultBranch: .default_branch
            visibility: .visibility

- kind: team
    selector:
    query: "true"
    port:
    entity:
        mappings:
        identifier: ".id | tostring"
        title: .name
        blueprint: '"githubTeam"'
        properties:
            name: .name
            slug: .slug
            description: .description
            link: .html_url
            permission: .permission
- kind: user
    selector:
    query: "true"
    port:
    entity:
        mappings:
        identifier: .login
        title: .login
        blueprint: '"githubUser"'
        relations:
user: .email -
Click
Save & Resyncto apply the mapping.
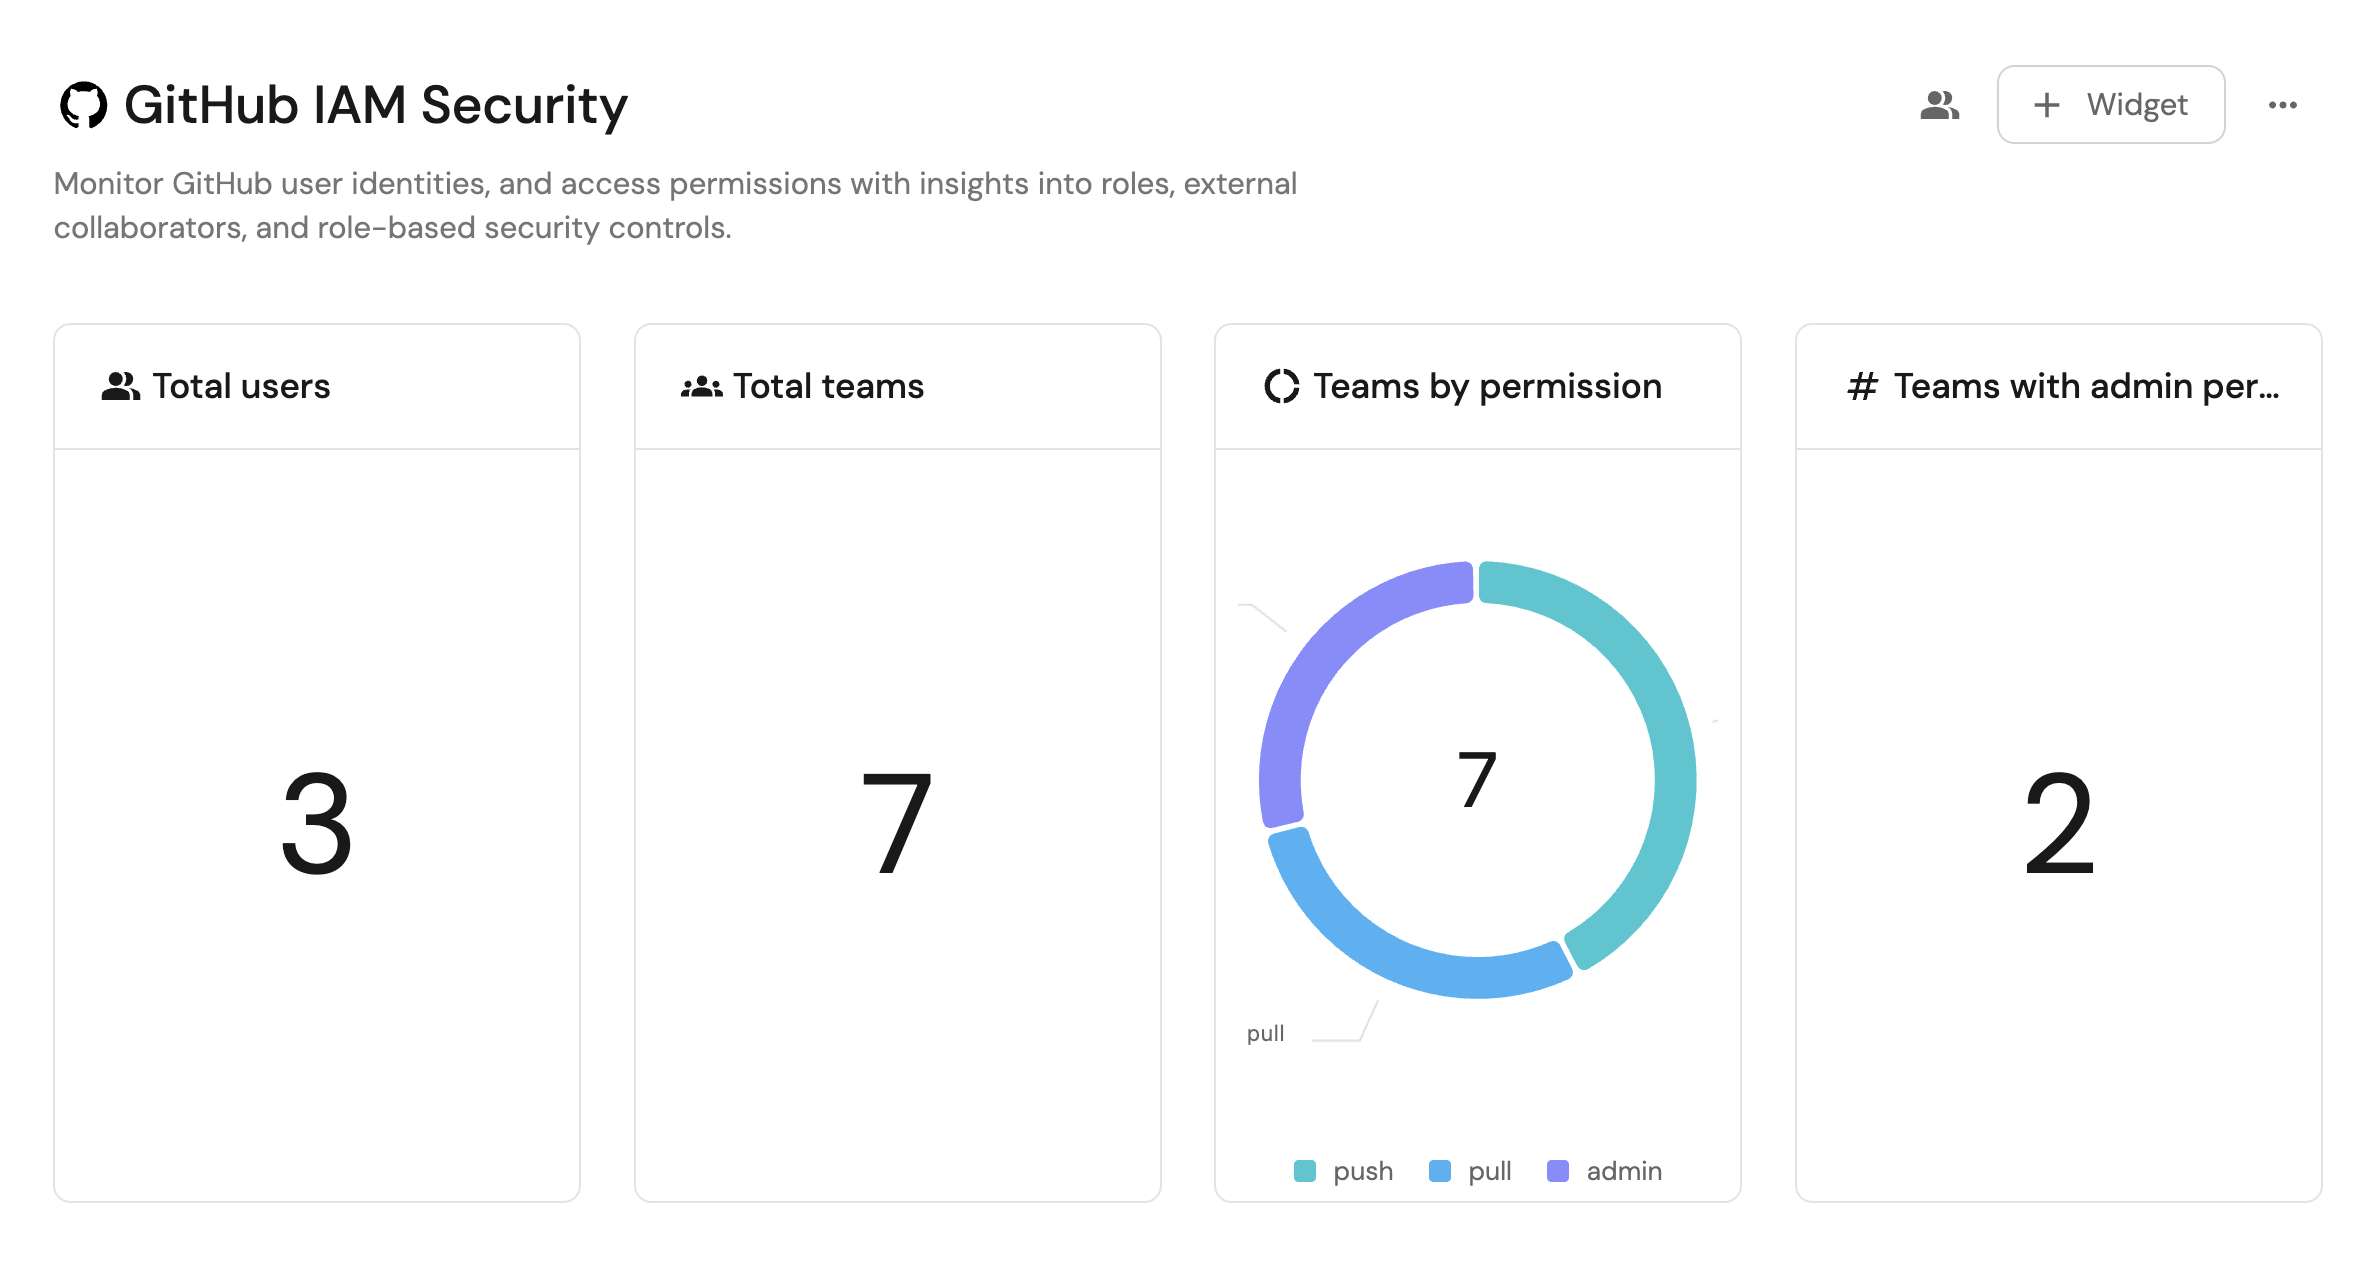
Visualize metrics
Once the GitHub data is synced, we can create a dashboard and add widgets to monitor IAM.
Create a dashboard
- Navigate to your software catalog.
- Click on the
+ Newbutton in the left sidebar. - Select New dashboard.
- Name the dashboard GitHub IAM Overview.
- Click
Create.
We now have a blank dashboard where we can start adding widgets to visualize our identity and access management.
Add widgets
Teams by permission (click to expand)
-
Click
+ Widgetand select Pie chart. -
Title:
Teams by permission. -
Choose the GitHub Team blueprint.
-
Under
Breakdown by property, select the Permission property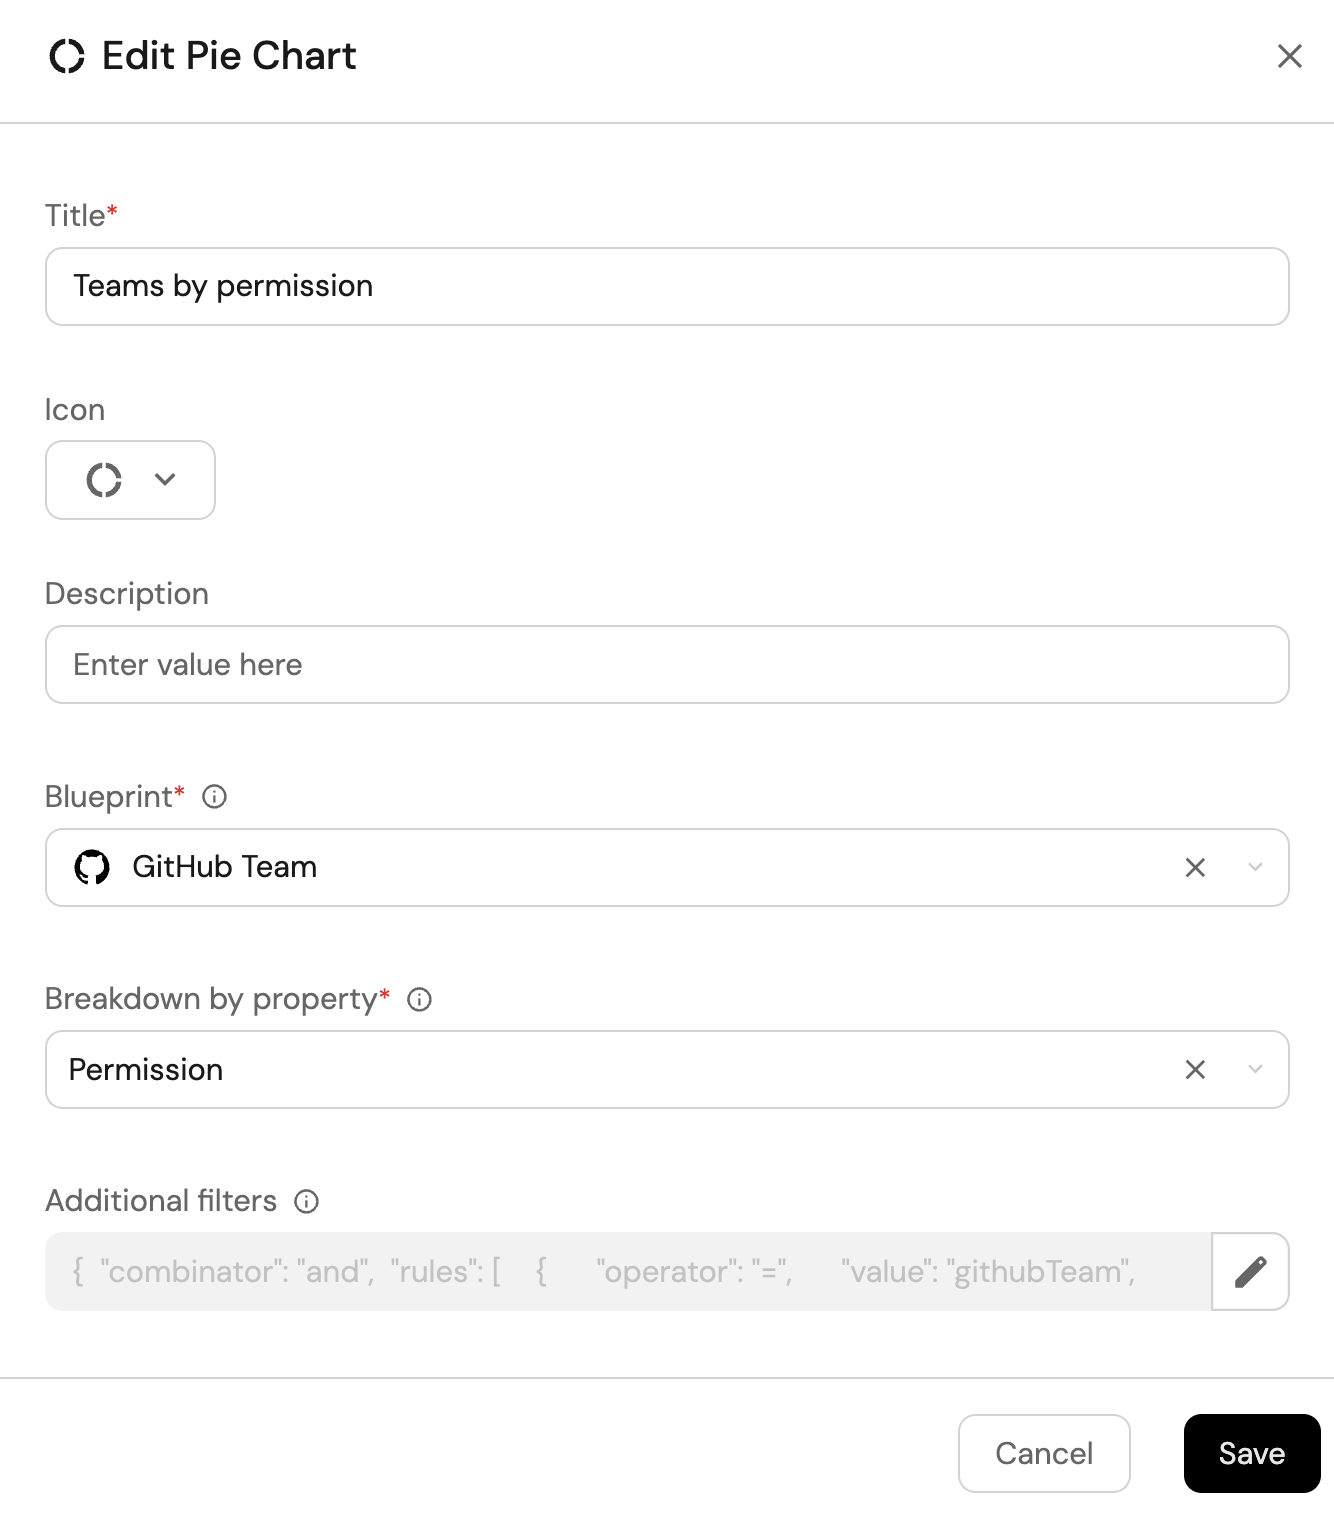
-
Click Save.
Teams with admin permission (click to expand)
-
Click
+ Widgetand select Number Chart. -
Title:
Teams with admin permission. -
Select
Count entitiesChart type and choose GitHub Team as the Blueprint. -
Select
countfor the Function. -
Add this JSON to the Additional filters editor to filter
adminpermission:[
{
"combinator":"and",
"rules":[
{
"property":"permission",
"operator":"=",
"value":"admin"
}
]
}
] -
Select
customas the Unit and inputteamsas the Custom unit.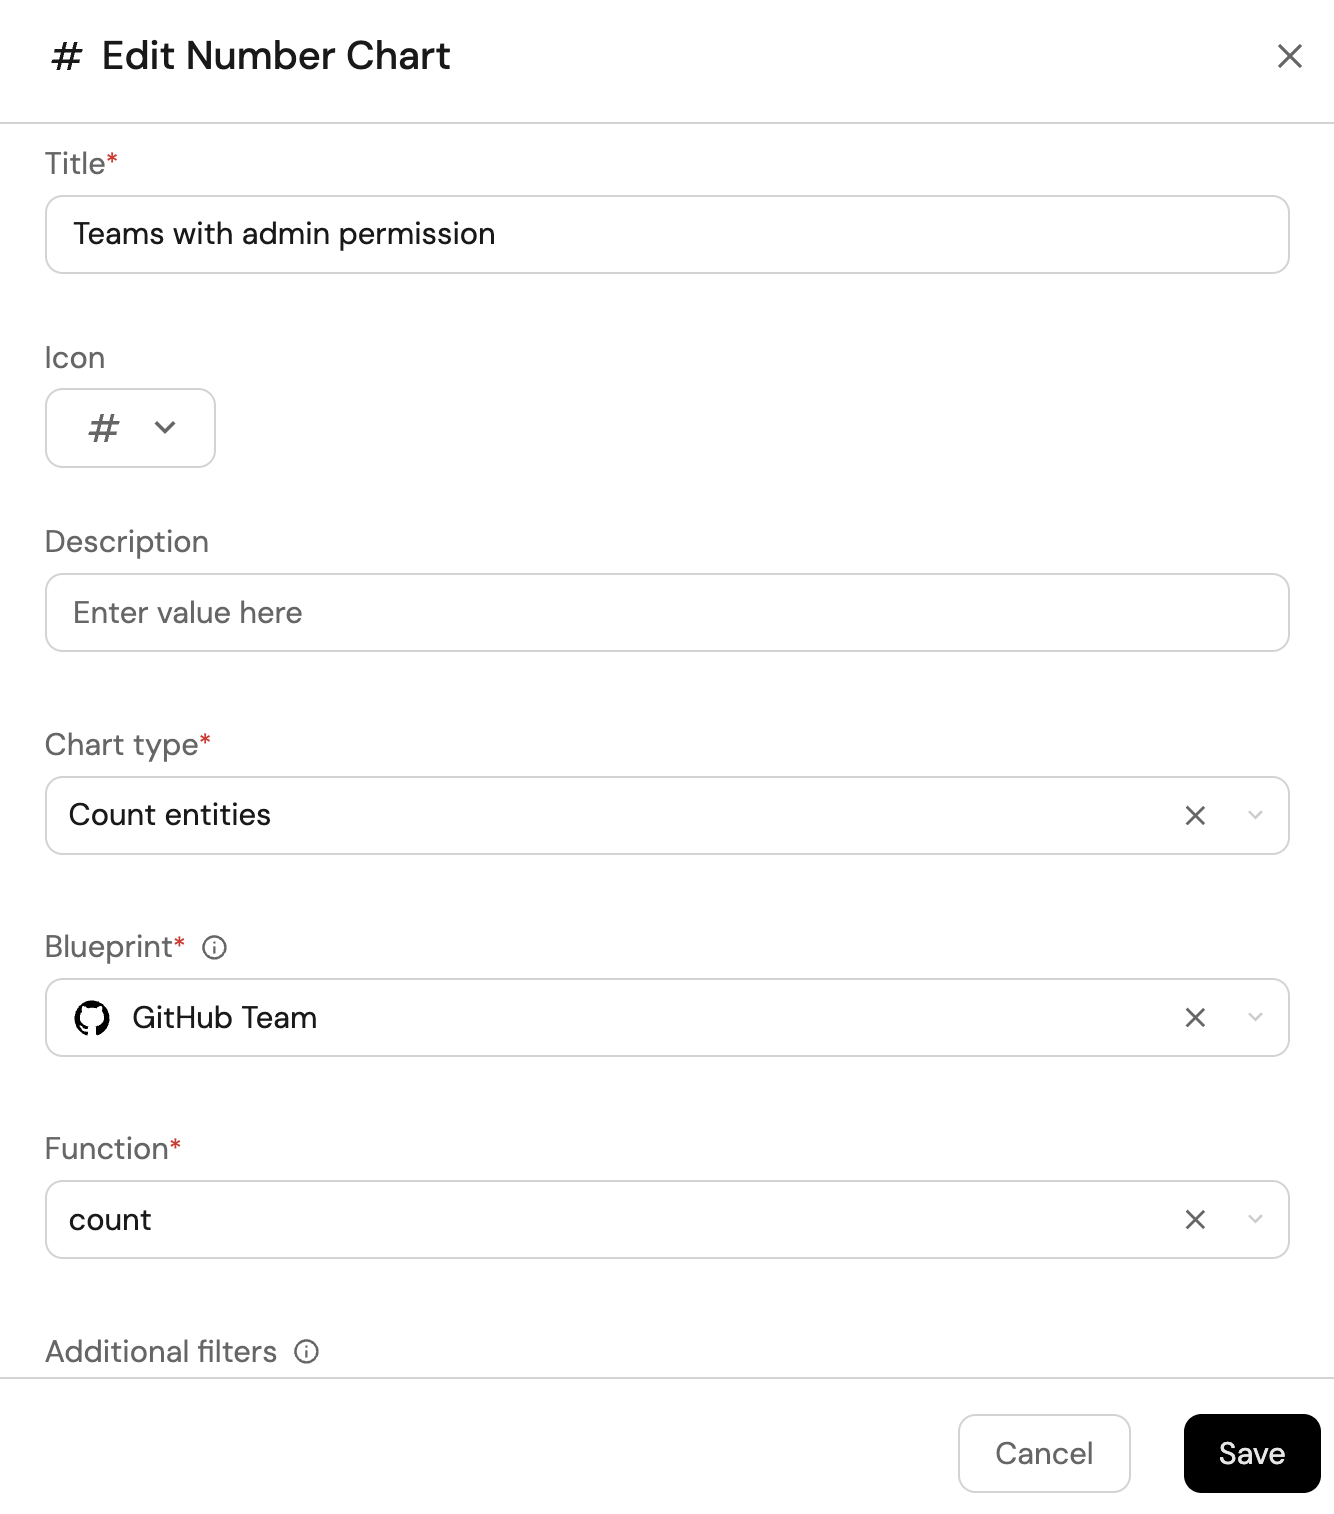
-
Click
Save.
Total number of teams (click to expand)
-
Click
+ Widgetand select Number Chart. -
Title:
Total teams(add theTeamicon). -
Select
Count entitiesChart type and choose GitHub Team as the Blueprint. -
Select
countfor the Function.
-
Click
Save.
Total number of users (click to expand)
-
Click
+ Widgetand select Number Chart. -
Title:
Total users(add theTeamicon). -
Select
Count entitiesChart type and choose GitHub User as the Blueprint. -
Select
countfor the Function.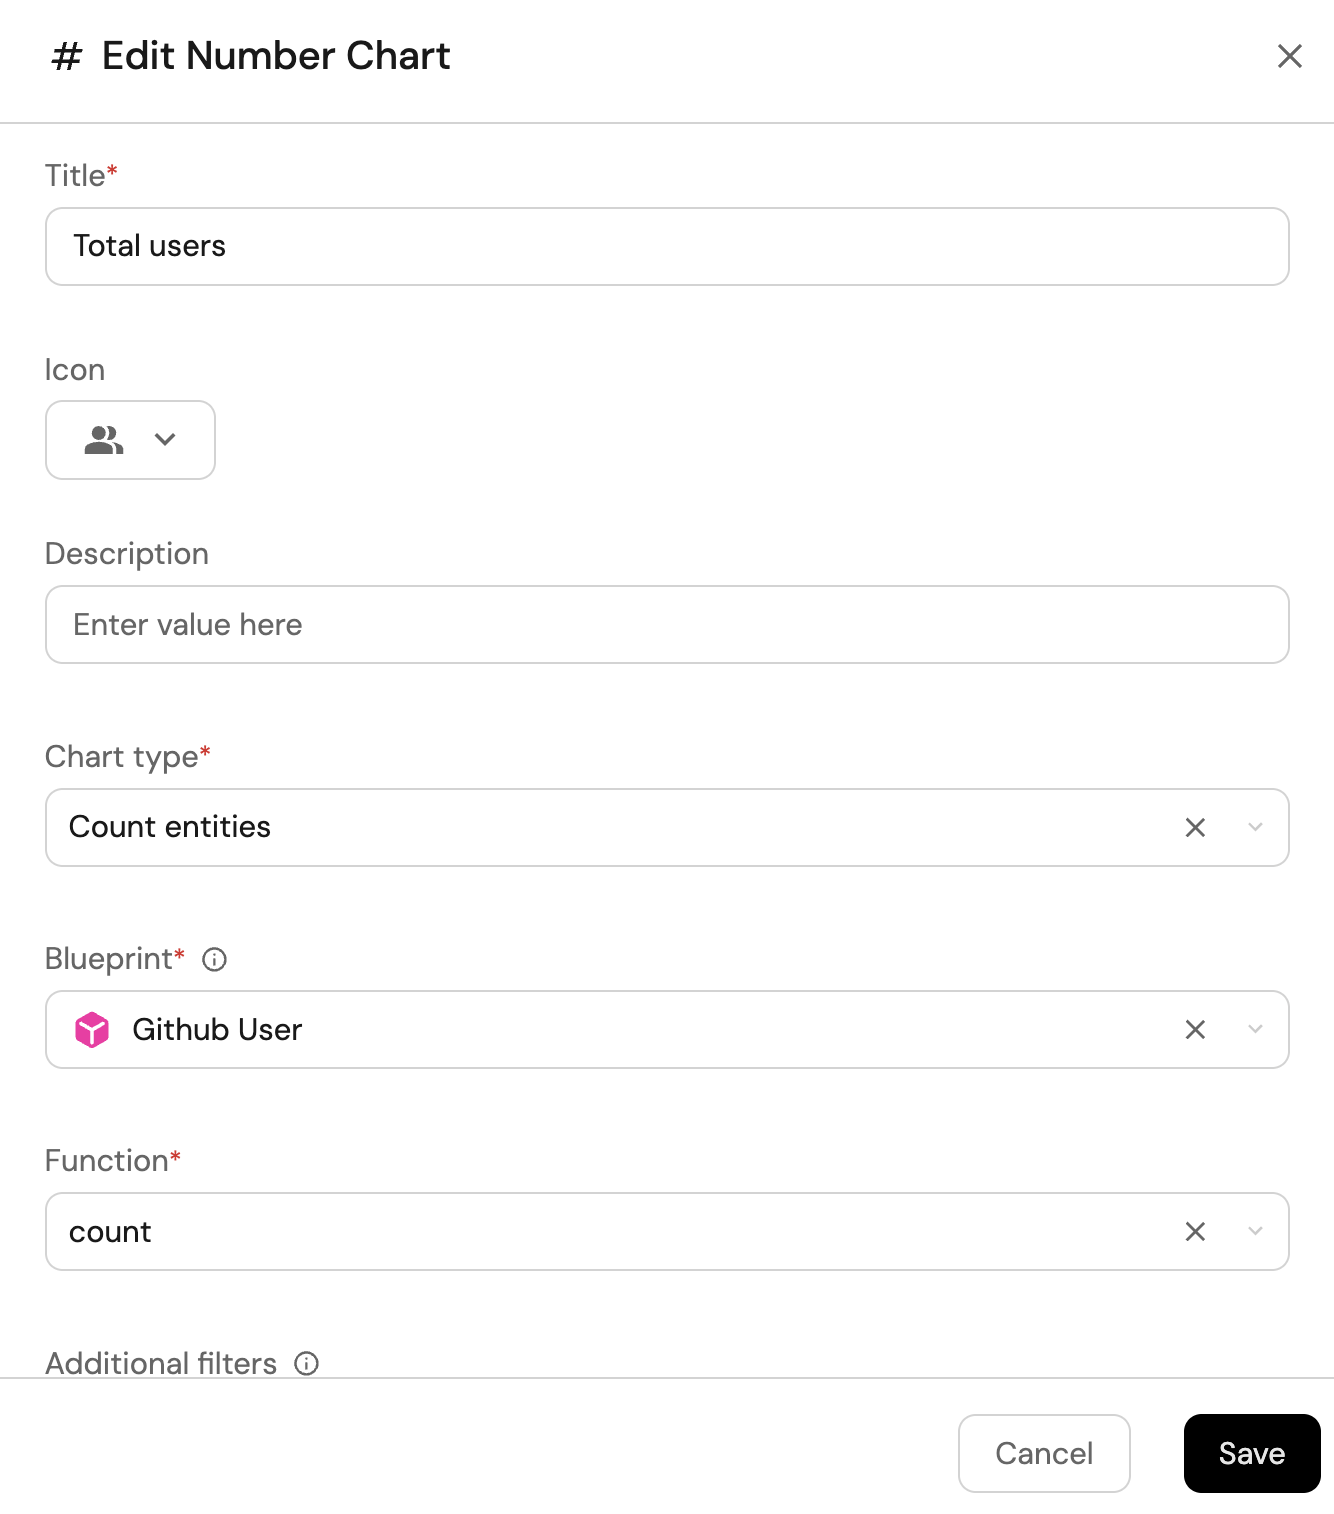
-
Click
Save.